
Fleet Size, Distribution, and Mix
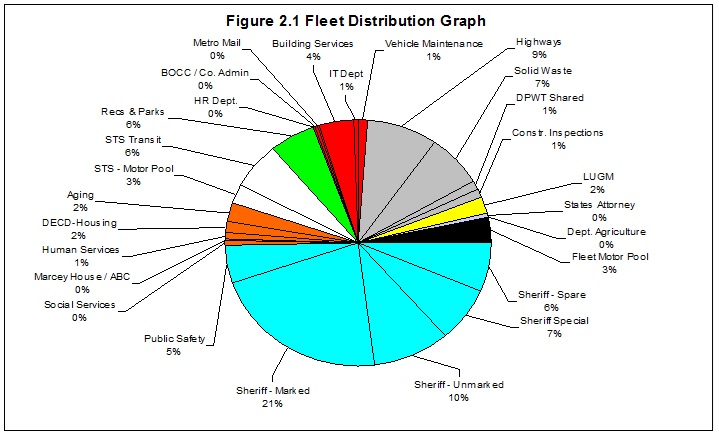
The Division will annually integrate new vehicles and equipment by evaluating and rotating the fleet mix based the condition and needs of the balance of the fleet. As of July 1, 2010, the County-maintained fleet was comprised of approximately 462 tagged (a 3% reduction from fiscal year 2009) and 108 non-tagged vehicles with a replacement value of approximately $22M and an original purchase price of $15.4M. The average age of the tagged and non-tagged fleet is 8 and 16 years respectively. As shown in the Fleet Distribution Graph (See Figure below), approximately 50% of the fleet is dedicated to law enforcement and public safety, 23% to DPW&T, and 9% for the local transit system.
The primary factors driving fleet-related costs for any organization are the size and composition of the fleet. The more vehicles an organization owns, the higher the annual cost to that organization, because for each fleet asset there are costs associated with ownership and operation. Even under-utilized vehicles consume fuel and maintenance resources each year. More importantly, these units also depreciate and lose value each and every day even if they are older and are fully amortized (i.e., paid for). Time and effort are also required to maintain appropriate licenses, tags, fleet inventory records, insurance, fuel cards, etc. The units may also take up valuable space at maintenance yards, parking lots and impound lots.